| tuning: |
| port influence |
| adjusting line |
|
|
|
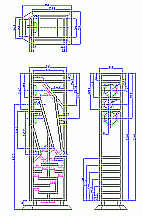
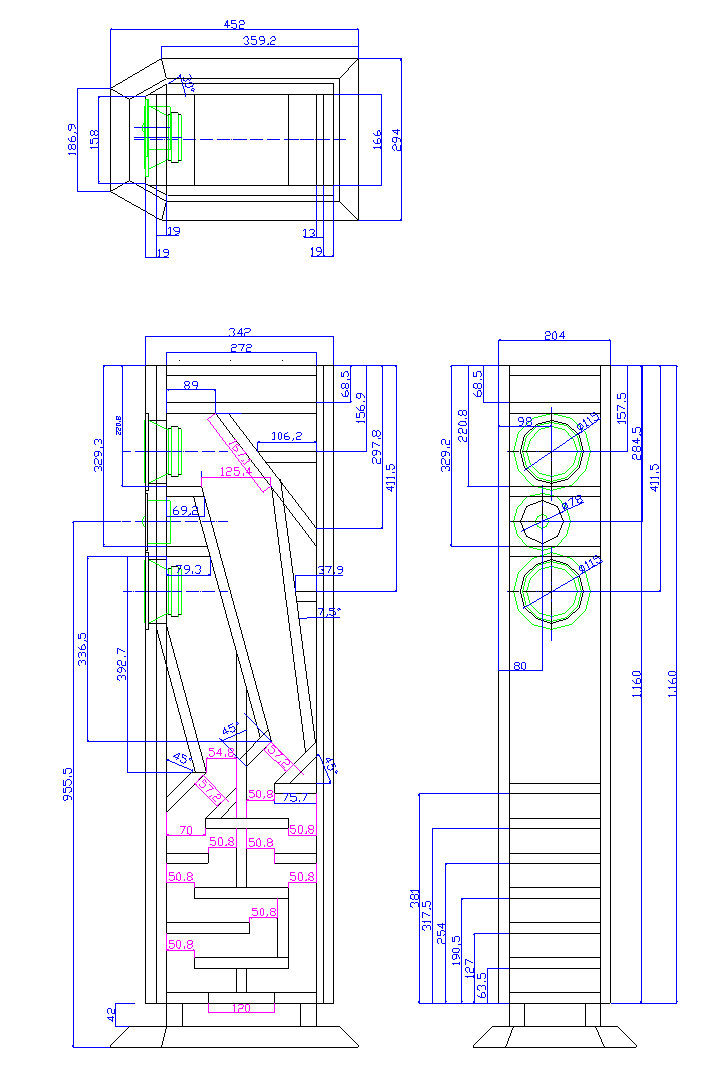
| The design of the housing is made with Autocad R14 in metric values. The drawing on the right is a GIF-picture optimized for direct print out. If you are able to work with the Autocad-format click here for the original design drawing download. Left and right housing is mirror-inverted. |
|
|
|
|
|
|
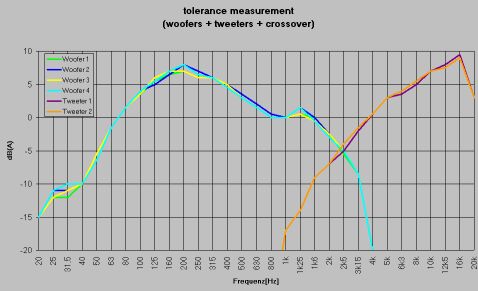
The measurements are made 1 cm in front of the
loudspeakers. One measurement for each speaker including the crossover as
described in components. The soundpressure difference between the speakers are
less than 1dB !!
|
|
|
|
Port Influence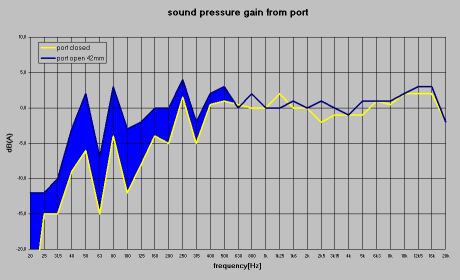
|
The left picture shows a 2 meter nearfield measurement on the axis of the tweeter. The blue area shows the gain of sound pressure on account of the port. Investigations show that the port opening (length of the bushings) has a big influence on the impedance of the woofer, but little influence on the gain of sound pressure. All distances greater than 25mm have nearly the same sound pressure. The best combination between system dynamic behaviour and bass level i reached with a distance of 42mm and a line damping as shown in the next chart. |
|
|
|
Adjusting Line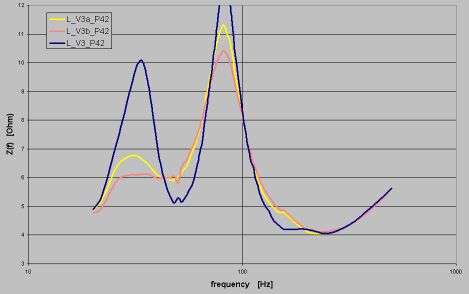
|
To obtain the desired sound, you have to adjust the damping of the line quite careful. Damping is mainly influenced by the kind, the amount and the location of the material. Behind the woofers it is recommended to use wool felt to lower resonaces from the panels and minimize acustic standing- waves. The staight parts of the line can be lightly filled with polyfill. A useful help for adjusting is to calculate the system- impedance out of the measured current. To my experiece good dynamic bass is in accordance with a sufficient damping of the line resonance --> the lower resonance peak in the chart. The red line shows the endversion for damping which leads to a damping factor of Qts=0,6. Pictures for location of damping material look under galerie. |
|
|
|
![]()
© 2002 by korherr •